How to Analyze Platform Activity and View Statistics?
12.06.2026
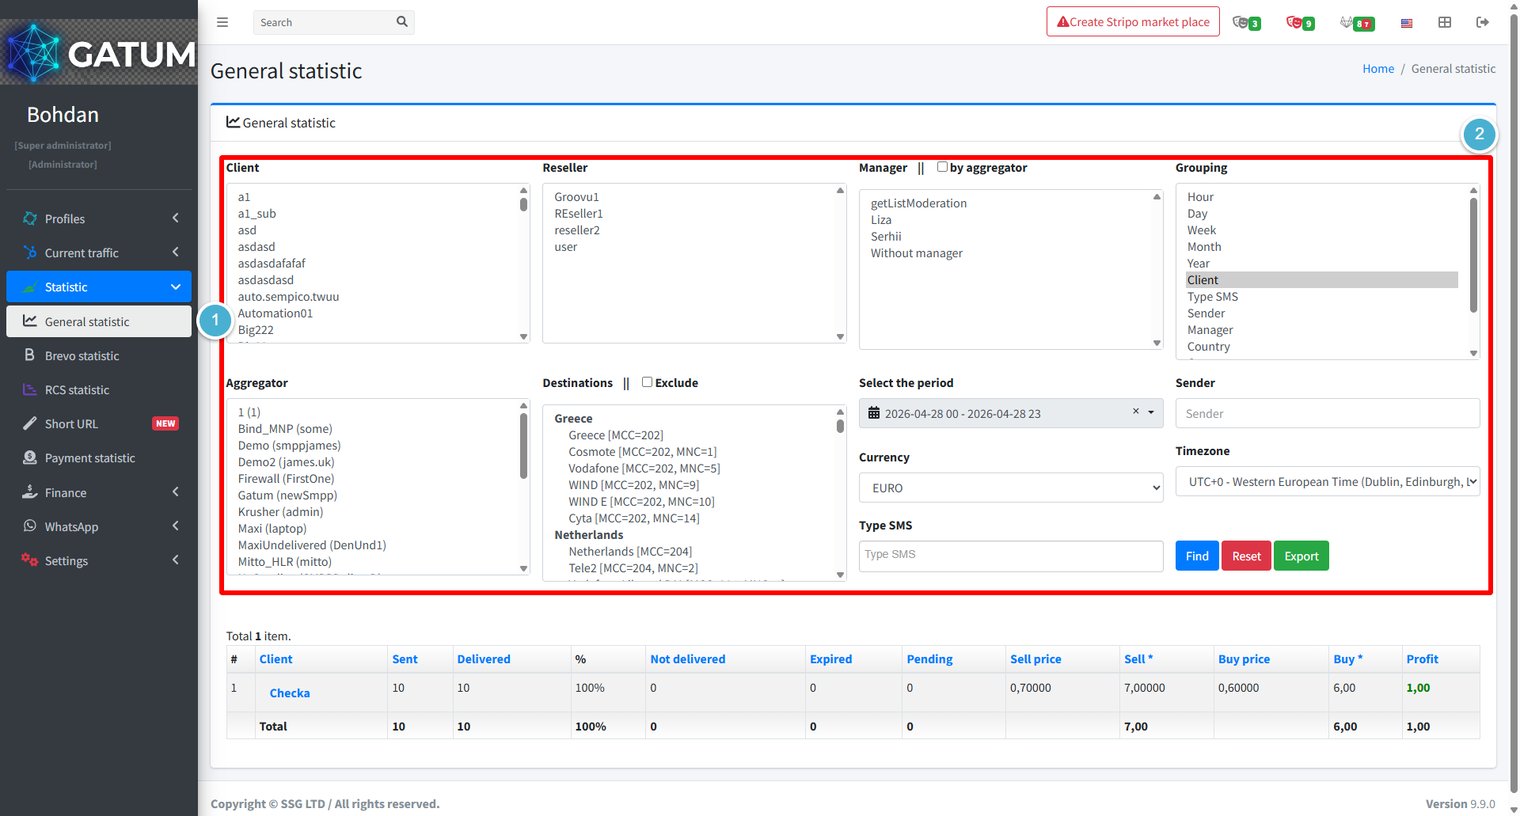
General statistic gives you a complete picture of traffic across the platform – sent and delivered volumes, delivery rates, revenue, costs, and profit – all filterable by client, aggregator, destination, time period, and more. All data is updated in real time, so messages sent seconds ago are already reflected in the results.
Go to Statistic → General statistic.
Use the filter panel to define exactly what data you want to see. You can combine any number of filters at once. Hold Ctrl (or Cmd on Mac) to select multiple values in list filters.
Filter
Description
Client
Filter by one or more clients.
Reseller
Filter by reseller.
Manager
Filter by manager. Check by aggregator to group by the aggregator's manager instead of the client's.
Grouping
How to aggregate the results: Hour, Day, Week, Month, Year, Client, Type SMS, Sender, Manager, or Country. You can select multiple groupings to combine them.
Aggregator
Filter by one or more aggregators.
Destinations
Filter by country or network. Check Exclude to show all traffic except the selected destinations.
Select the period
The date and time range to include.
Currency
The currency in which prices and profit are displayed.
Sender
Filter by sender name.
Timezone
The timezone used for time-based grouping.
Type SMS
Filter by message type.
Click Find to run the query. Results appear in the table below the filters with the following columns: Client, Sent, Delivered, %, Not delivered, Expired, Pending, Sell price, Sell (total revenue), Buy price, Buy (total cost), and Profit.
Click Reset to clear all filters and start over.
Click Export to download the current result set as a CSV file. The file reflects exactly the filters and grouping active at the time of export, so set up your filters first before exporting.
When a message is held for review instead of being sent immediately, it means it was caught by one of the platform's moderation mechanisms. Understanding why this happens helps you manage traffic more effectively and configure moderation to match your workflow.
Reason 1:...
Why do SIDs get moderated, and how to set it up?
Sender ID moderation lets you control which sender names your clients can use. When it's enabled, a client can't send SMS with a new sender until you approve it. This helps you keep traffic clean and avoid unexpected sender names going out.
Go...
Why Do SMS Get Into the Waiting List?
When there is not enough balance to send all messages in a campaign, the platform automatically moves the unsent SMS to the Waiting SMS queue instead of dropping them. Once you top up your balance, you can resend them manually.
For example, if...
Cookie declaration last updated on 01/01/2025
This website uses cookies
We use cookies to enhance your browsing experience, provide social media features, and analyze our traffic.
You consent to our cookies if you continue to use our website.