In order to make it convenient for you to conduct analytics of your activities, provide reports to clients and partners – on the SMPP platform GATUM we have created statistics with detailed filtering, this is our pride, because now you can quickly find the information you need and analyze its effectiveness.
In order to view general statistics, you need:
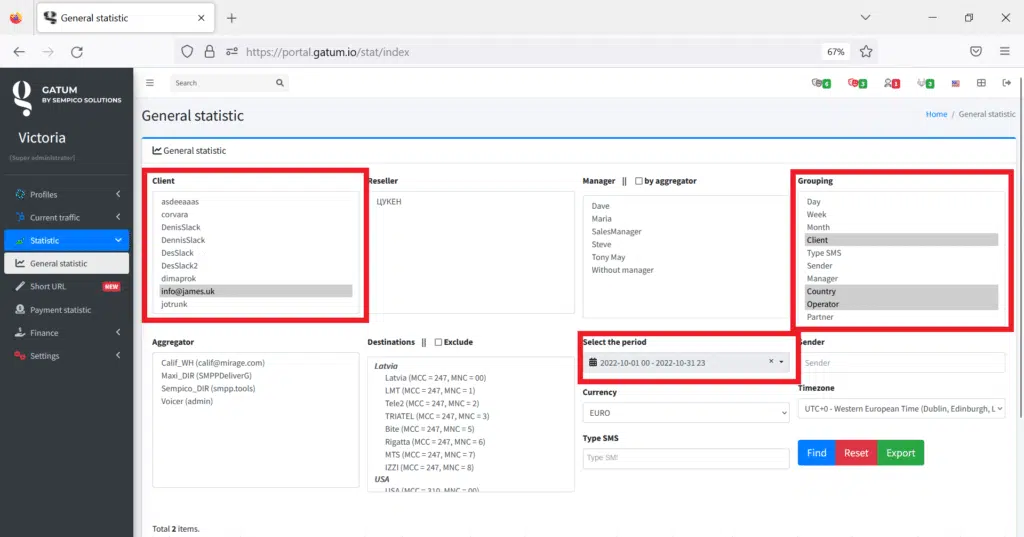
- Go to the Statistic -> General statistic tab.
- Use filtering to select the data you want to find.
Here’s a very detailed filtering to help you find the metrics you want across all of your activities.
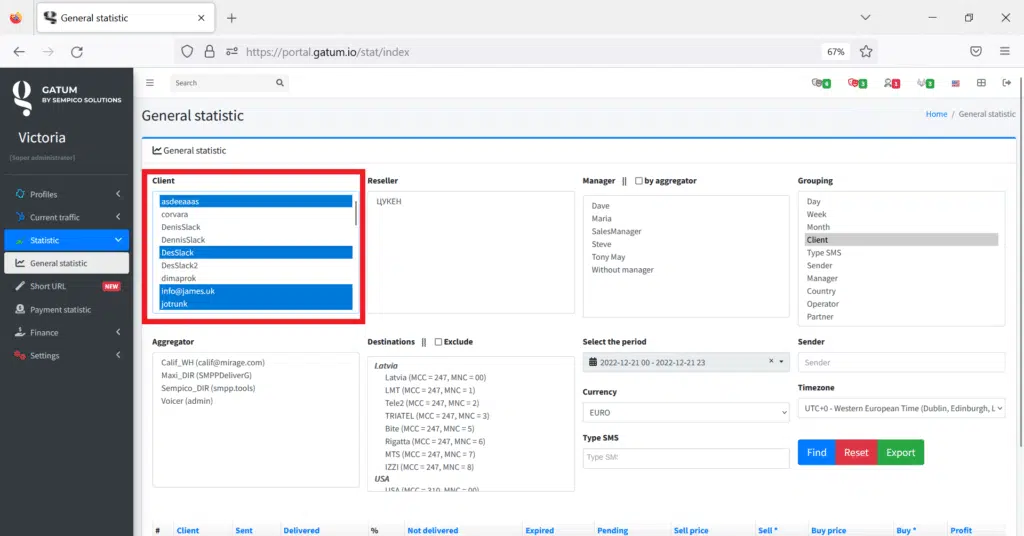
For example, if you want to see your earnings from one client for a specific month, you can use the following filters:
Choose a client. Using the keyboard shortcut Ctrl + Shift, you can select multiple positions in the filter.
Monthly grouping and the month you need.
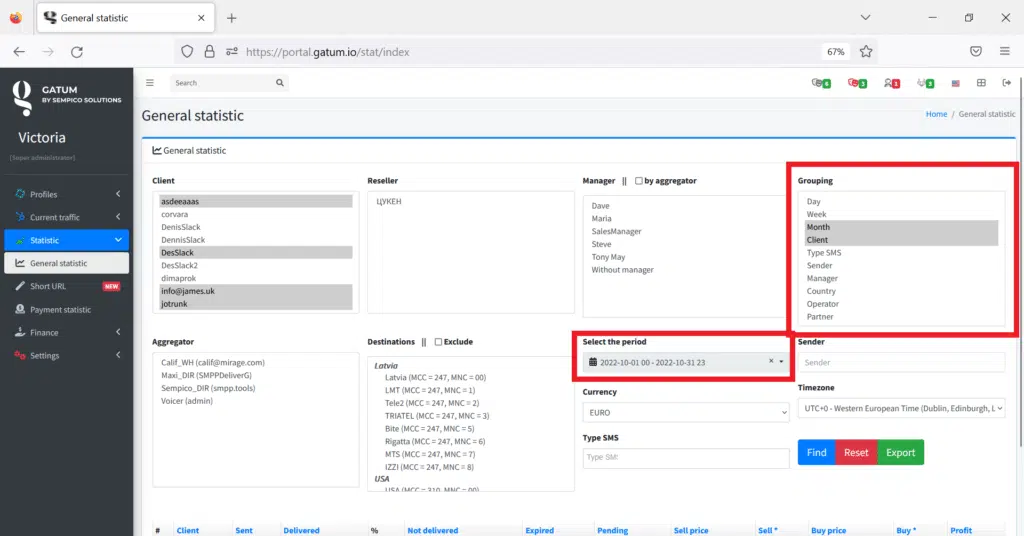
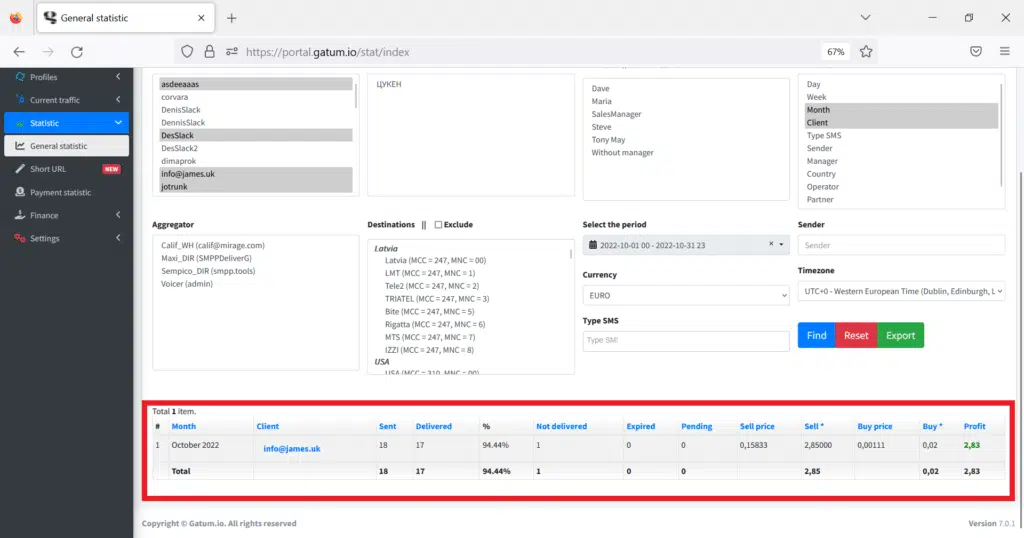
Click on the Find button and the information you need will be displayed below.
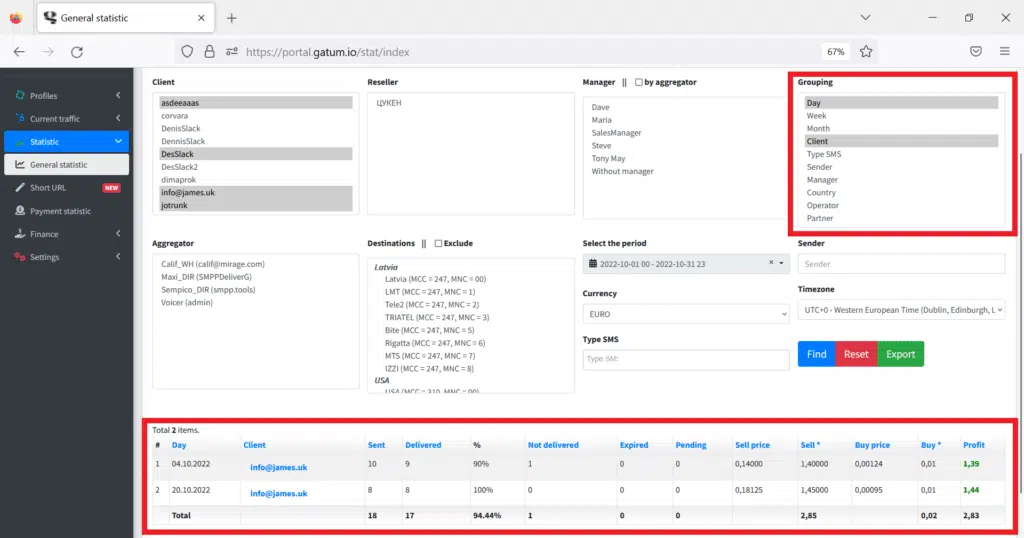
You can also use grouping by day and you will be shown activity statistics for each day for the selected period.
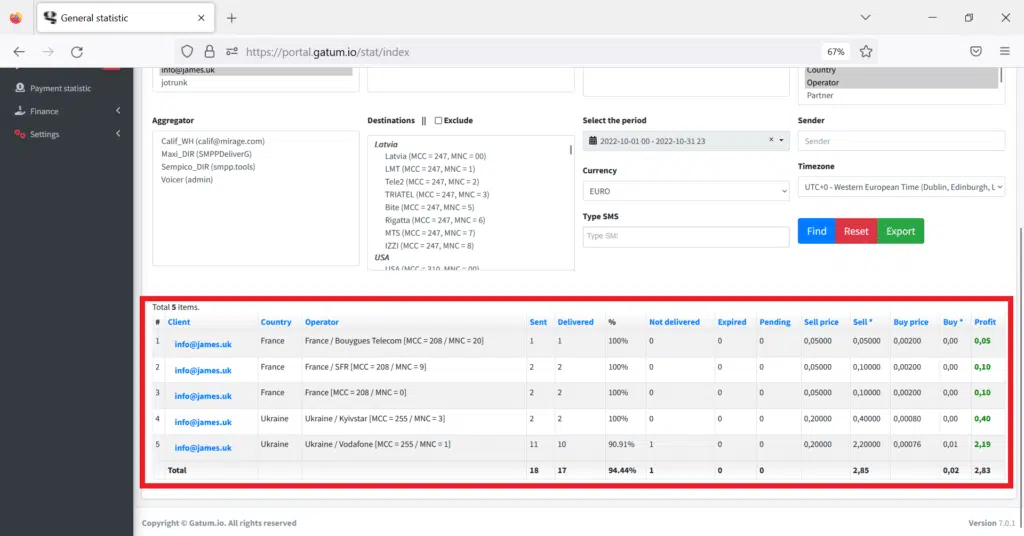
Often, data from general statistics is used to bill a client.
To do this, in the filtering select:
The client. Grouping by country and operator. Time period.
Click on the Find button and the data for the selected period on the client’s traffic will appear at the bottom.
You can export data using the Export button. The CSV file is downloaded to your device.
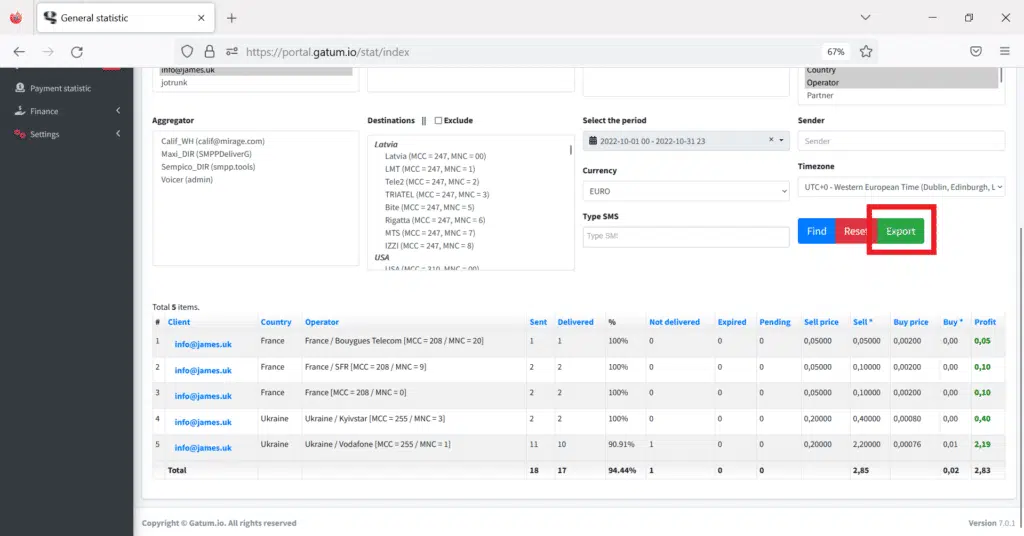
Press the Reset button to reset the filtration.
And so, this tab will help you analyze your activities and the activities of your customers, costs and profits.
You can filter and manage data as you like: mix filters among themselves, filter statistics by sender, directions or aggregators, customize the display in different currencies and in different time zones, use several groupings at the same time, and download the Result at any time.
Moreover, all data is displayed in statistics in real time, without delay. So even if the SMS was sent a few seconds ago, it is already displayed in the general statistics.
This is how you can easily analyze the activities on the platform and search for the data you need.
